本篇大綱#
要怎麼監控 K8s 的狀態呢?CPU、記憶體的使用量還有網路狀況要如何監控,對 SRE 來說這是必備的,今天就來安裝 kube-prometheus-stack 可以看到 K8s 使用狀況。
內文#
Kubernetes 上最常被提到的監控組合,有錢的解決方案就像是 ElasticSearch + Logstash + Kibana ELK 組合以外,開源的解決方案就是 Prometheus + Grafana,今天就來介紹 Prometheus + Grafana 的組合。
Prometheus#

Prometheus 是個開源監控警告系統,原本是 SoundCloud 建立使用,先後有其他公司跟團隊加入開發,現在是個獨立的開源專案沒有被其他公司持有,2016 年也跟隨 Kubernetes 加入 CNCF。
Prometheus 最大的特點就是他用蒐集資料是根據時間,用 Time Series 做為 Base 去紀錄 CPU Memory,寫入跟讀取資料都是使用 HTTP 作為 Base,串接資料來說也是蠻方便的。
繼續安裝以前,還要來介紹搭配的工具 Grafana。
Grafana#

Grafana 是由 Grafana Labs 開發,Cloud 版本會有更多的圖表還有更多的資料來源,但 OSS 版本本身就很夠用了,可以直接跟 Prometheus 做串接,做視覺化的功能居多,自家開發的工具都可以跟 Grafana Dashboard 做整合,蠻方便的。
稍微簡介完了以後,就可以來開始安裝了!
安裝#
這裡我會用 Helm Chart 的 kube-prometheus-stack 作為安裝:https://github.com/prometheus-community/helm-charts/tree/main/charts/kube-prometheus-stack
他們還蠻常在更新的,這次會使用 Chart Version 40.3.1
那就可以先一如往常慣例加入 Repo 更新:
helm repo add prometheus-community https://prometheus-community.github.io/helm-charts
helm repo update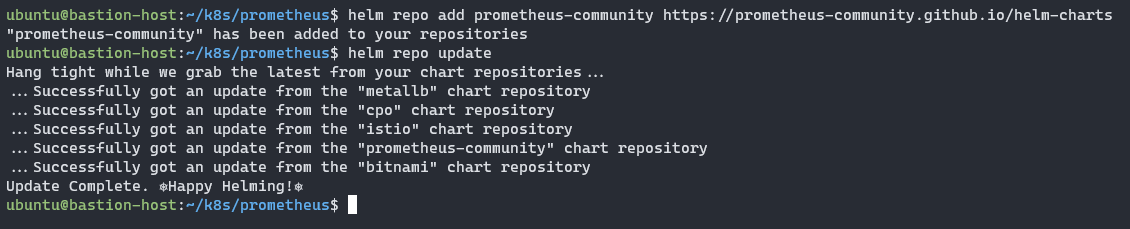
那就可以把預設的 values.yaml 拿出來做編輯:
helm show values prometheus-community/kube-prometheus-stack --version 40.3.1 > values.yaml我這裡會特別動幾個 values
.alertmanager.enabled改為false.grafana.defaultDashboardsTimezone改為Asia/Taipei.grafana.adminPassword記得要去更改.prometheus.prometheusSpec.retentionTime改為空字串"".prometheus.prometheusSpec.retentionSize改為9GB.prometheus.prometheusSpec.storageSpec改為下列:
    storageSpec:
      volumeClaimTemplate:
        spec:
          storageClassName: csi-cinder-sc-retain
          accessModes: ["ReadWriteOnce"]
          resources:
            requests:
              storage: 10Gi
那我們就可以來安裝了:
helm install -f values.yaml prometheus-stack prometheus-community/kube-prometheus-stack -n prometheus-stack --version 40.3.1 --create-namespace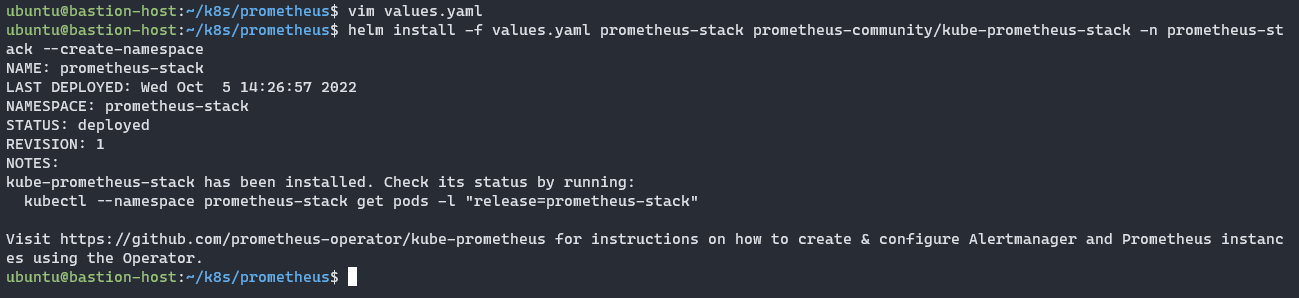
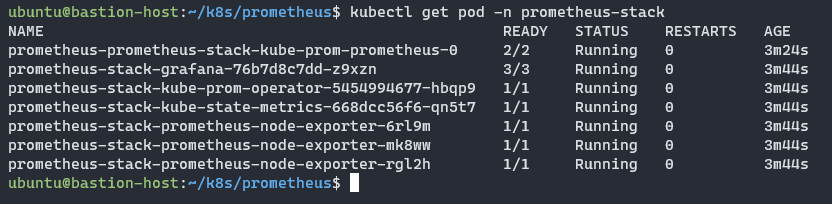
可以看看 Pod 有沒有任何問題
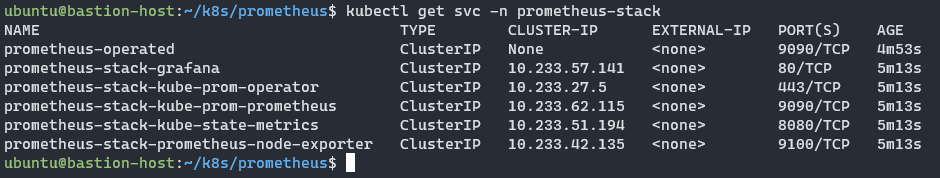
確認一下 Service 名稱,等等就要設定 VirtualService 對外公開 Grafana。
接下來在把 VirtualService 設定給 Grafana :
apiVersion: networking.istio.io/v1beta1
kind: VirtualService
metadata:
  name: grafana-vs
spec:
  hosts:
    - grafana.yjerry.tw
  gateways:
    - istio-ingress/my-ingressgateway
  http:
  - name: "grafana"
    route:
    - destination:
        host: prometheus-stack-grafana
        port:
          number: 80
設定檔寫完就可以套用進去:
kubectl apply -f grafana-vs.yaml -n prometheus-stack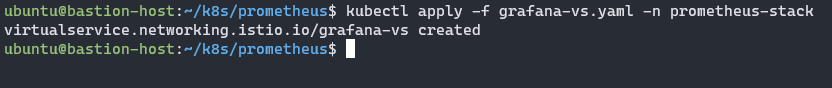
就可以打上網址:https://grafana.yjerry.tw
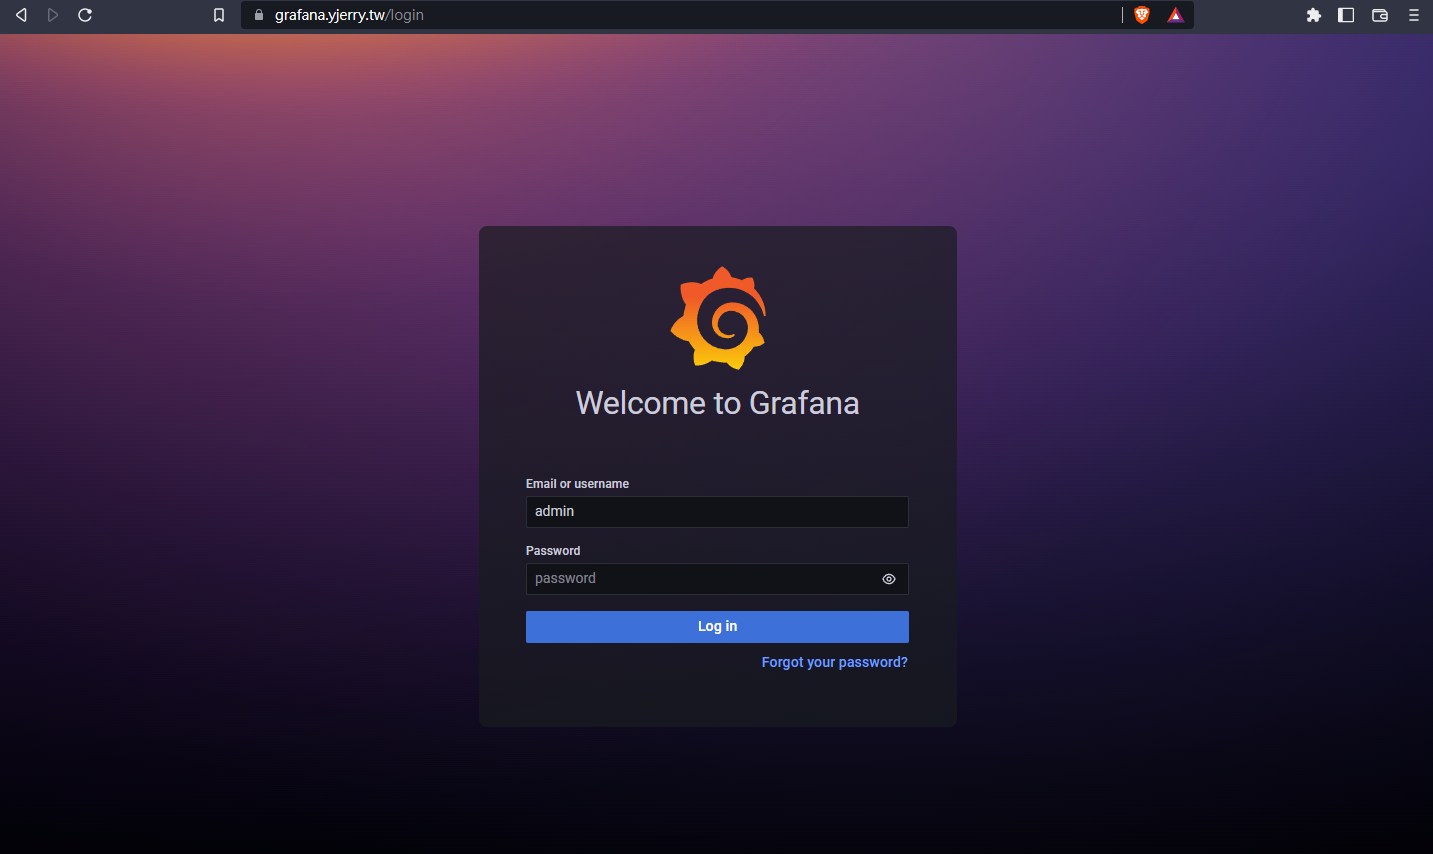
就可以輸入密碼剛剛 values.yaml 寫的 .grafana.adminPassword 進去。
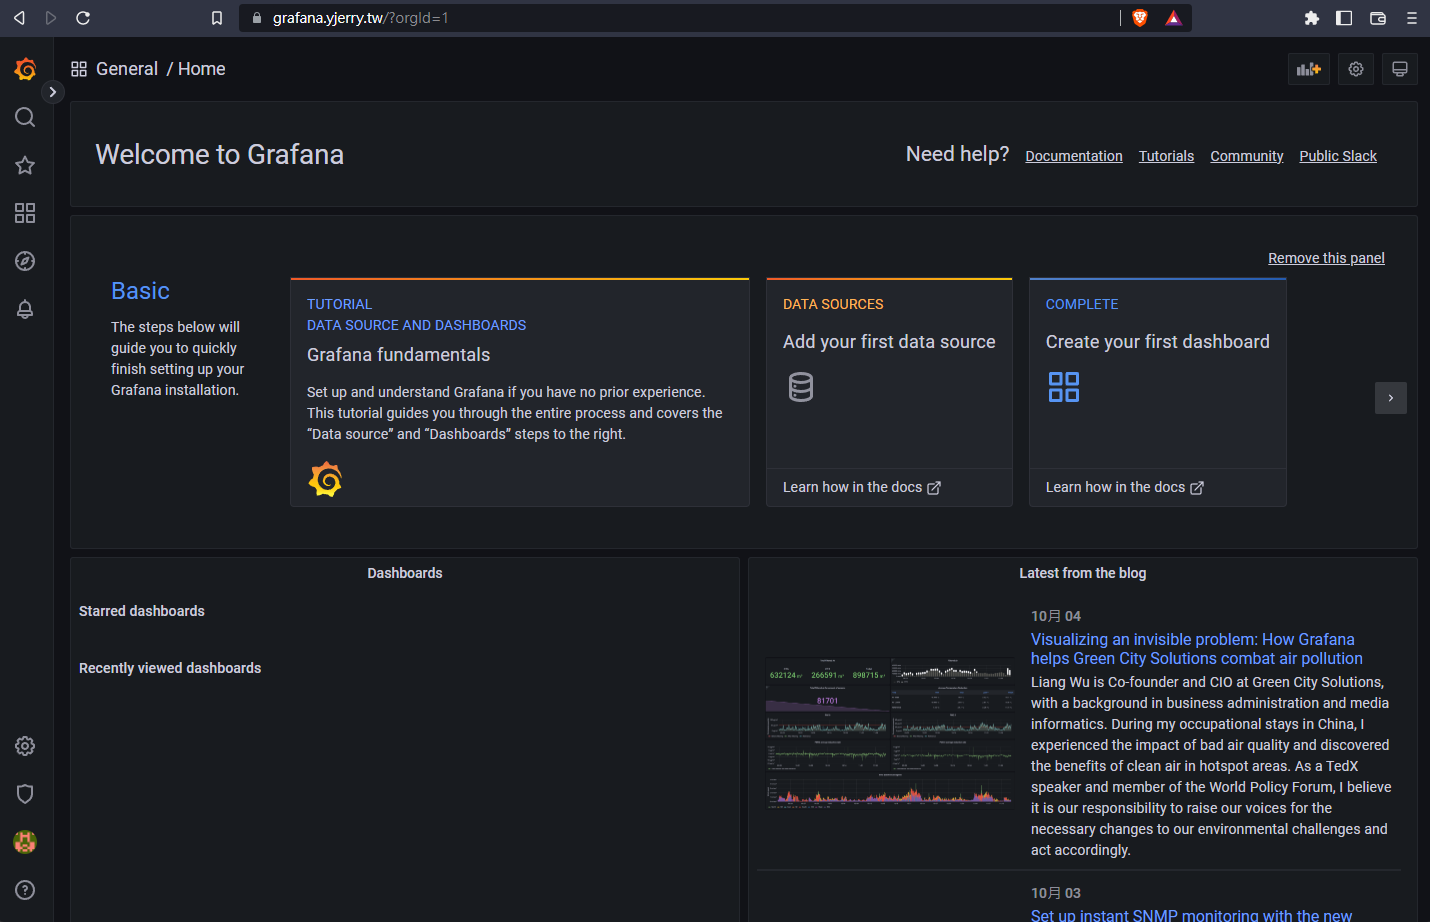
只要來到這裡就代表已經設定成功了,下一篇我將介紹如何觀看裡面的資料!
本系列內容也會同步貼到我的 iT 邦幫忙 https://ithelp.ithome.com.tw/users/20112934 歡迎來點一下追蹤,那我們就下一篇文章見啦!