《關於我怎麼把一年內學到的新手 IT/SRE 濃縮到 30 天筆記這檔事》 Day 24 Prometheus + Grafana 監控整合工具 kube-prometheus-stack
本篇大綱
要怎麼監控 K8s 的狀態呢?CPU、記憶體的使用量還有網路狀況要如何監控,對 SRE 來說這是必備的,今天就來安裝 kube-prometheus-stack 可以看到 K8s 使用狀況。
內文
Kubernetes 上最常被提到的監控組合,有錢的解決方案就像是 ElasticSearch + Logstash + Kibana ELK 組合以外,開源的解決方案就是 Prometheus + Grafana,今天就來介紹 Prometheus + Grafana 的組合。
Prometheus

Prometheus 是個開源監控警告系統,原本是 SoundCloud 建立使用,先後有其他公司跟團隊加入開發,現在是個獨立的開源專案沒有被其他公司持有,2016 年也跟隨 Kubernetes 加入 CNCF。
Prometheus 最大的特點就是他用蒐集資料是根據時間,用 Time Series 做為 Base 去紀錄 CPU Memory,寫入跟讀取資料都是使用 HTTP 作為 Base,串接資料來說也是蠻方便的。
繼續安裝以前,還要來介紹搭配的工具 Grafana。
Grafana

Grafana 是由 Grafana Labs 開發,Cloud 版本會有更多的圖表還有更多的資料來源,但 OSS 版本本身就很夠用了,可以直接跟 Prometheus 做串接,做視覺化的功能居多,自家開發的工具都可以跟 Grafana Dashboard 做整合,蠻方便的。
稍微簡介完了以後,就可以來開始安裝了!
安裝
這裡我會用 Helm Chart 的 kube-prometheus-stack 作為安裝:https://github.com/prometheus-community/helm-charts/tree/main/charts/kube-prometheus-stack
他們還蠻常在更新的,這次會使用 Chart Version 40.3.1
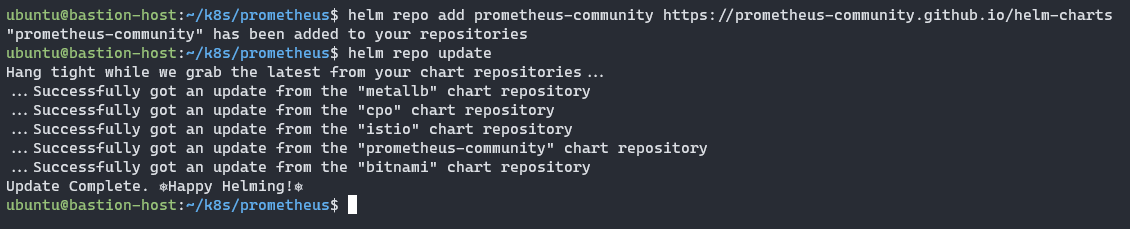
那就可以先一如往常慣例加入 Repo 更新:
1 | |
那就可以把預設的 values.yaml 拿出來做編輯:
1 | |
我這裡會特別動幾個 values
.alertmanager.enabled改為false.grafana.defaultDashboardsTimezone改為Asia/Taipei.grafana.adminPassword記得要去更改.prometheus.prometheusSpec.retentionTime改為空字串"".prometheus.prometheusSpec.retentionSize改為9GB.prometheus.prometheusSpec.storageSpec改為下列:
1 | |
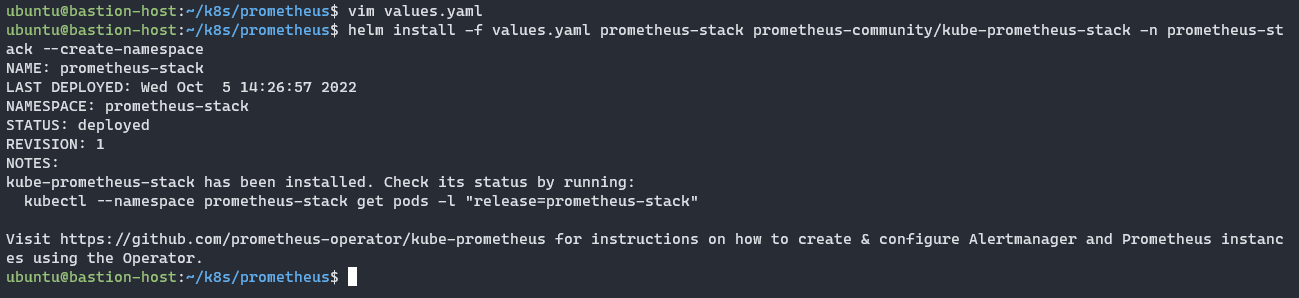
那我們就可以來安裝了:
1 | |
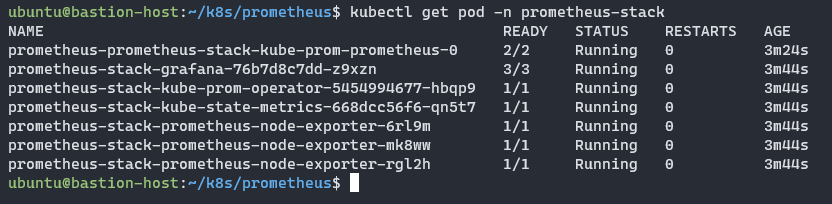
可以看看 Pod 有沒有任何問題
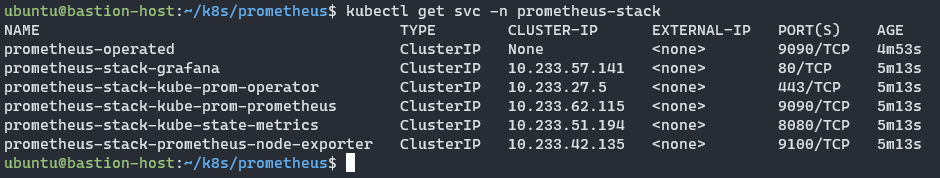
確認一下 Service 名稱,等等就要設定 VirtualService 對外公開 Grafana。
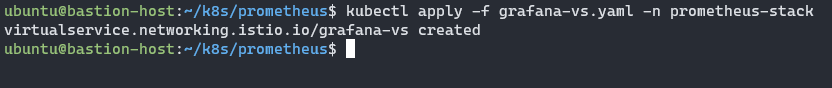
接下來在把 VirtualService 設定給 Grafana :
1 | |
設定檔寫完就可以套用進去:
1 | |
就可以打上網址:https://grafana.yjerry.tw
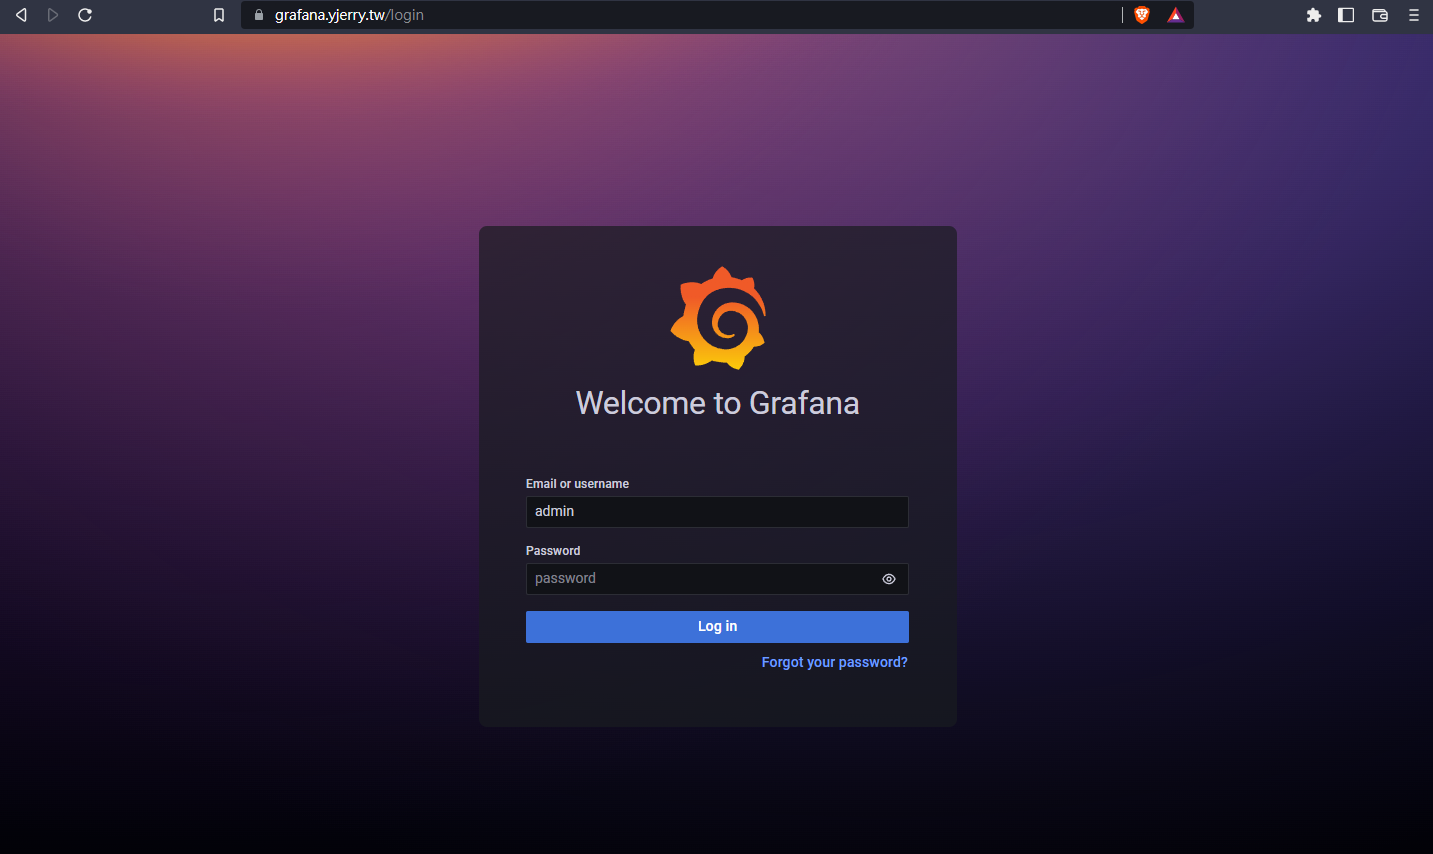
就可以輸入密碼剛剛 values.yaml 寫的 .grafana.adminPassword 進去。
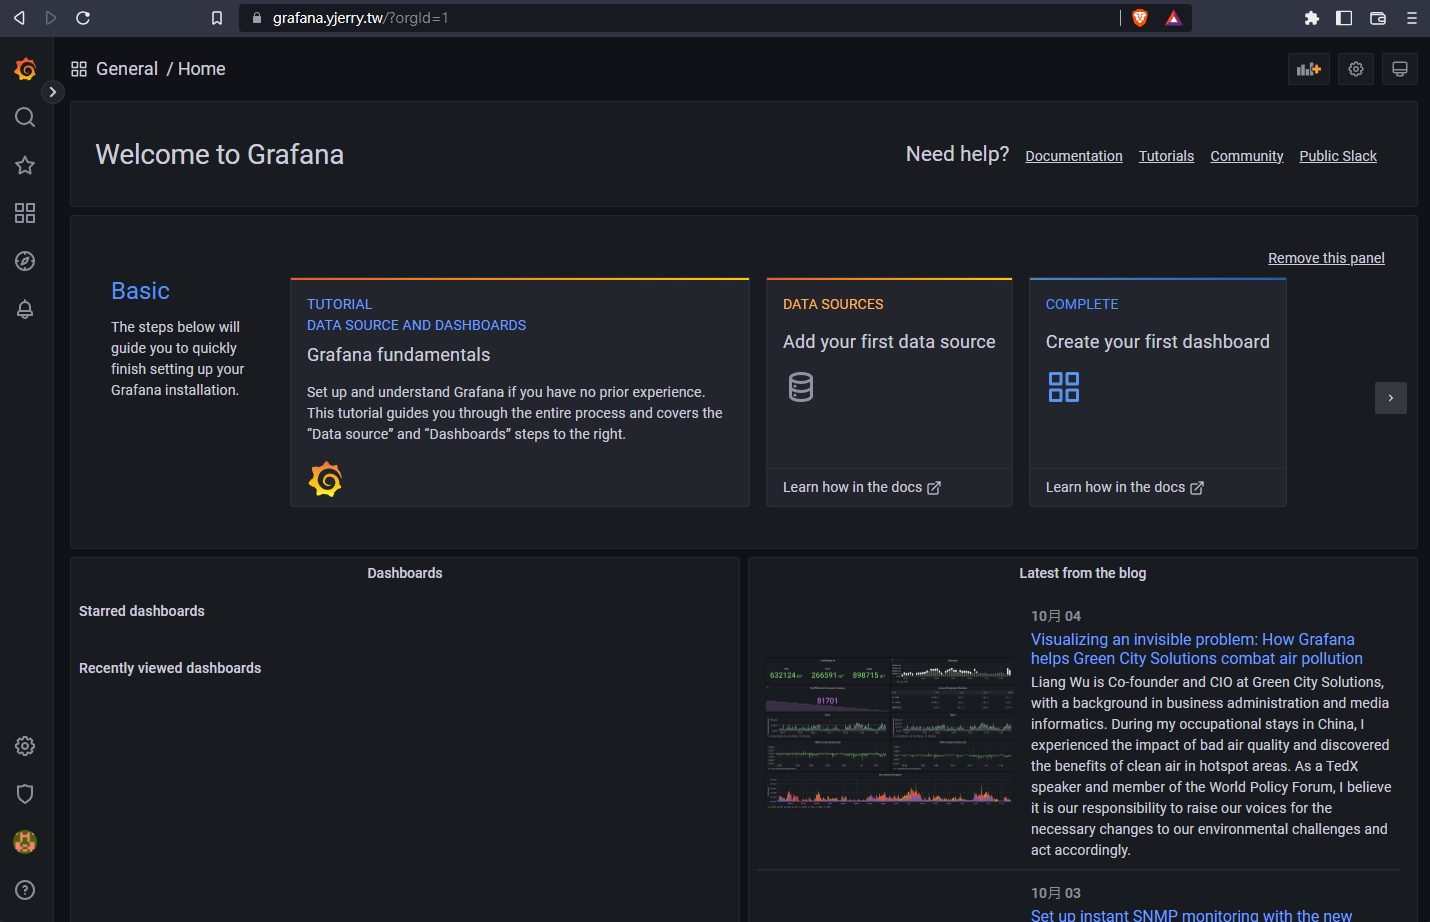
只要來到這裡就代表已經設定成功了,下一篇我將介紹如何觀看裡面的資料!
本系列內容也會同步貼到我的 iT 邦幫忙 https://ithelp.ithome.com.tw/users/20112934 歡迎來點一下追蹤,那我們就下一篇文章見啦!